clscripts
Repository for computational linguistics scripts (bash, python, octave, R, etc).
vgc.py
Create vocabulary growth curve data, compatible with zipfR package. Like heaps.py, it provides the first column with text length, the second with vocabulary size and subsequent columns display the number of types appearing from 1 to N times, where N is given by using the -V parameter.
script usage
Help shows the usage syntax and available parameters.
$ ./vgc.py --help
usage: vgc.py [-h] [-m MAXLEN] [-s SAMPLES] [-l] [-i FILE] [-V LEGOMENON] [-c]

optional arguments:
  -h, --help            show this help message and exit
  -m MAXLEN, --maxlen MAXLEN
                        Maximum length of the sample that will be analyzed.
  -s SAMPLES, --samples SAMPLES
                        Number of points in the output (linearly spaced or
                        logarithmically spaced). Use Inf or All to print every
                        single sample.
  -l, --log             Use logarithmic spaced samples.
  -i FILE, --input FILE
                        Input text file name.
  -V LEGOMENON, --legomenon LEGOMENON
                        Number of types in the corresponding frequency classes
                        at the specified Ns (-V 1: hapax legomena, -V 2: hapax
                        and dis legomenon, -V 3: hapax, dis and tris
                        legomenon, etc).
  -c, --counts          Print only counts (remove header)
usage examples
For the basic usage, just provide the text file as input. The example below present the first and last 5 lines of the result.
$ ./vgc.py -i ulysses.txt | (head -5; echo "..."; tail -5)
N	V 	V1
1	1 	1
2	2 	2
3	3 	3
4	4 	4
...
265062	45457 	29036
265063	45457 	29036
265064	45457 	29036
265065	45458 	29037
265066	45459 	29038
You can also read text from stdin, as illustrated in the example below.
$ ./vgc.py --maxlen 10 -V 3 < ulysses.txt
N	V 	V1 	V2 	V3
1	1 	1 	0 	0
2	2 	2 	0 	0
3	3 	3 	0 	0
4	4 	4 	0 	0
5	5 	5 	0 	0
6	6 	6 	0 	0
7	7 	7 	0 	0
8	8 	8 	0 	0
9	9 	9 	0 	0
10	9 	8 	1 	0
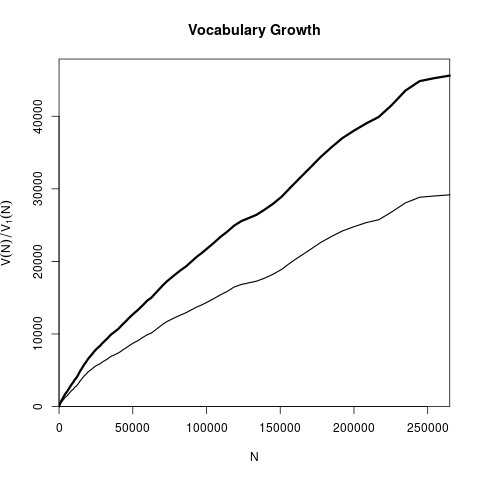
The result might be saved into a file and plotted. The example below uses R to plot the vocabulary growth in Ulysses by James Joyce.
$ ./vgc.py -i ulysses.txt --samples 256 --log -V 3 > ulysses.vgc
$ R
> uvgc = read.vgc('ulysses.vgc')
> png('ulysses_vgc.png')
> plot(uvgc, add.m=1)
> dev.off()
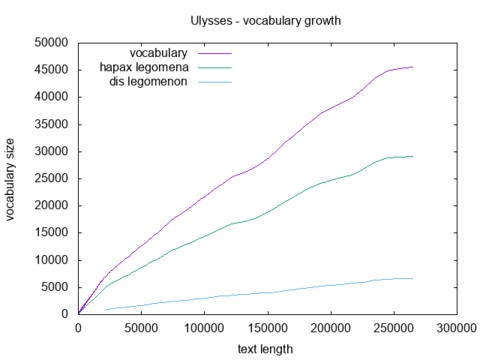
Or it might be done directly in shell using gnuplot:
$ ./vgc.py -i ulysses.txt --samples 256 --log -V 3 -c |
  awk -- '{print $0} END{print "e"}' |
  tee -i -a /dev/stdout /dev/stdout |
  gnuplot -e "set terminal png; set output 'ulysses_vgc2.png'; set xlabel 'text length'; set ylabel 'vocabulary size'; set title 'Ulysses - vocabulary growth'; set key left top; plot '-' using 1:2 with lines title 'vocabulary', '-' using 1:3 with lines title 'hapax legomena', '-' using 1:4 with lines title 'dis legomenon'"
awk was used just to add an e to the end. tee was used to replicate the stdout since gnuplot needs one data for each line.